Author: Rohan Tamang

  • Boeing Stock Falls About 9% as 737 Max Ramp-Up Slips to Late 2027

    Boeing Stock Falls About 9% as 737 Max Ramp-Up Slips to Late 2027

    INTRODUCTION

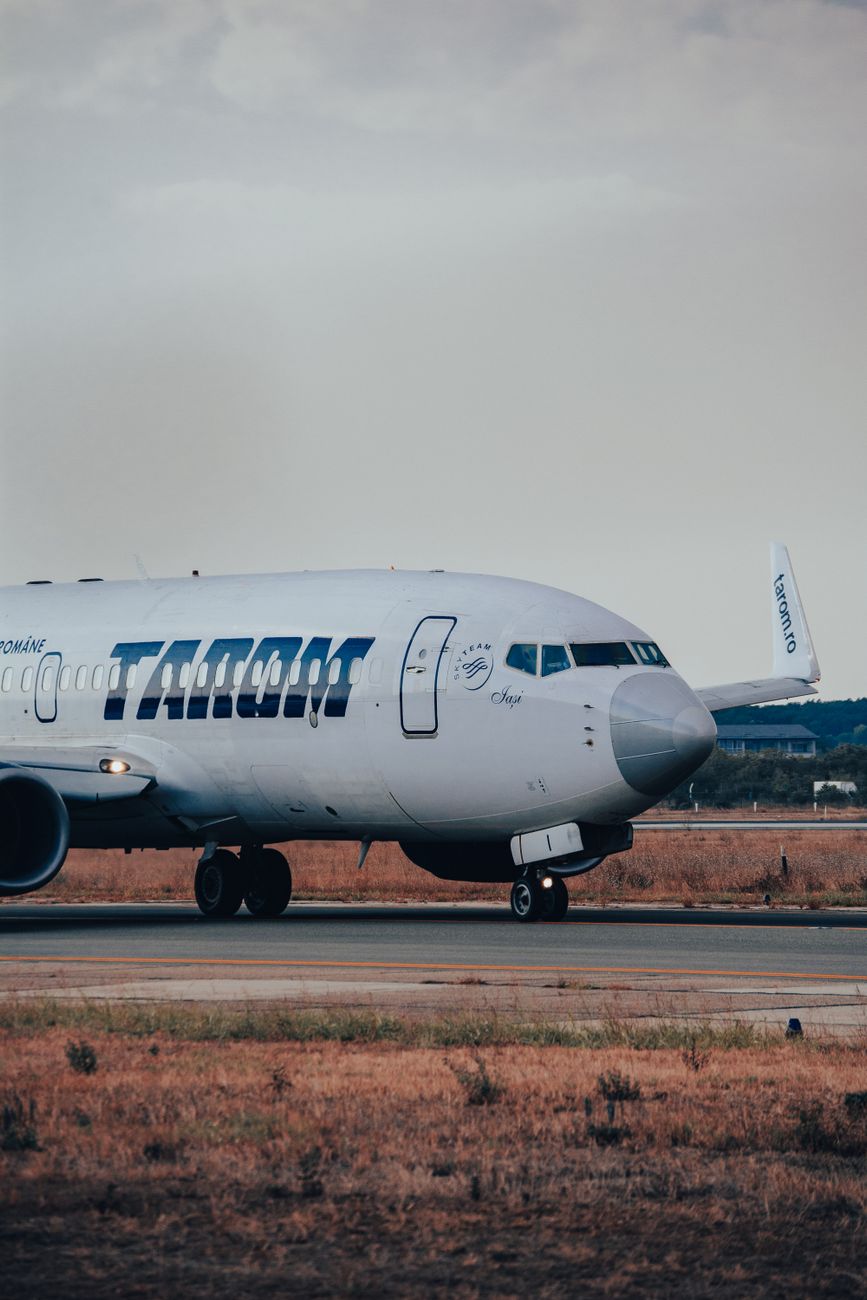
    Boeing had good news and bad news in its third-quarter results, and investors focused on the bad news. The company narrowed its loss sharply and grew revenue, but its shares fell about 9% during its earnings call. The reason was simple: Boeing said it will not significantly ramp up production of its best-selling 737 Max plane until the second half of 2027.

    WHAT HAPPENED

    Boeing reported a third-quarter net loss of $116 million, or 26 cents per share, compared with a $5.34 billion loss, or $7.14 per share, a year earlier. Revenue rose 4% to $24.19 billion, above the $23.84 billion analysts expected. Free cash flow rose to $464 million, up from $238 million a year earlier.

    But the adjusted loss per share, which strips out one-off items, was 34 cents, wider than the 21-cent loss analysts expected. And chief executive Kelly Ortberg said on the earnings call that Boeing is targeting a production rate of 52 planes a month only in the second half of 2027. The company is currently making about 47 Max planes a month.

    WHY IT HAPPENED

    The delay comes down to wings. Boeing has said that wing production is moving more slowly than expected, and stabilising production is taking longer than planned. Ortberg told CNBC that the company wants to get production right rather than go fast, saying, in effect, that everyone wants it to move faster but it will do the job properly.

    The commercial aircraft business also struggled. Its revenue fell 3% to $10.72 billion, and it posted a negative operating margin of 6.5%, which Boeing blamed on a less favourable mix of deliveries, higher expected costs from future production changes, and higher supply chain costs. Boeing delivered 161 commercial airplanes in the quarter, just one more than a year earlier.

    The defence business was the bright spot. Defence revenue jumped 15% to $7.94 billion, which helped narrow the overall loss.

    KEY FIGURES

    • Third-quarter net loss: $116 million, vs $5.34 billion a year earlier
    • Revenue: $24.19 billion, up 4%, vs $23.84 billion expected
    • Adjusted loss per share: 34 cents, vs 21 cents expected
    • Free cash flow: $464 million, vs $238 million a year earlier
    • Commercial aircraft revenue: $10.72 billion, down 3%
    • Commercial airplanes delivered: 161
    • Defence revenue: $7.94 billion, up 15%
    • 737 Max production now: about 47 a month; target: 52 a month in the second half of 2027
    • Shares: down about 9% during the earnings call

    WHY IT MATTERS

    Boeing only makes most of its money on a plane when it delivers it to an airline. That is why production speed matters so much. A delay of several months in ramping up from 47 to 52 planes a month means fewer deliveries, less cash coming in, and a slower recovery.

    It also matters for airlines. Many airlines are waiting for new 737 Max planes to grow their fleets and replace older aircraft. If Boeing delivers more slowly, airlines may have to keep older planes flying longer or wait longer to add routes.

    WHAT HAPPENS NEXT

    There was one piece of good regulatory news. The Federal Aviation Administration signed off on the 737 Max 10, after approving the 737 Max 7 in August. Those were the final certifications for the Max family. But certification is not the same as delivery, and Boeing still needs to prove it can build planes steadily at higher rates without quality problems.

    Investors will now watch three things: whether Boeing can stabilise production at 47 planes a month, whether wing output improves, and whether free cash flow keeps growing. Boeing expects to deliver 30 pre-built 737-7 and 737-10 aircraft starting in 2027, which could help cash flow in 2028 and beyond. But that is still a long way off.

    FINAL THOUGHTS

    Boeing’s quarter shows a company making real progress and still disappointing the market at the same time. The loss is much smaller, revenue beat expectations, and cash flow improved. But in the aircraft business, promises about future production matter as much as today’s numbers. Until Boeing can show it can build planes faster, and safely, investors will keep treating every delay as a reason to sell.

    Related post: https://thefinanceclass.wordpress.com/2026/10/30/ford-beats-earnings-2027-profit-flat-costs/

    Disclaimer: This article is for educational and informational purposes only and does not constitute financial advice.

    Sources: CNBC, https://www.cnbc.com/2026/10/27/-boeing-ba-q3-2026-earnings.html; PrimeXBT, https://primexbt.com/news/boeing-stock-falls-9-as-737-max-ramp-up-slips-to-late-2027/
  • Cruise Lines Split on Fuel Costs: Carnival Cuts Use, Rivals Hedge Prices

    Cruise Lines Split on Fuel Costs: Carnival Cuts Use, Rivals Hedge Prices

    INTRODUCTION

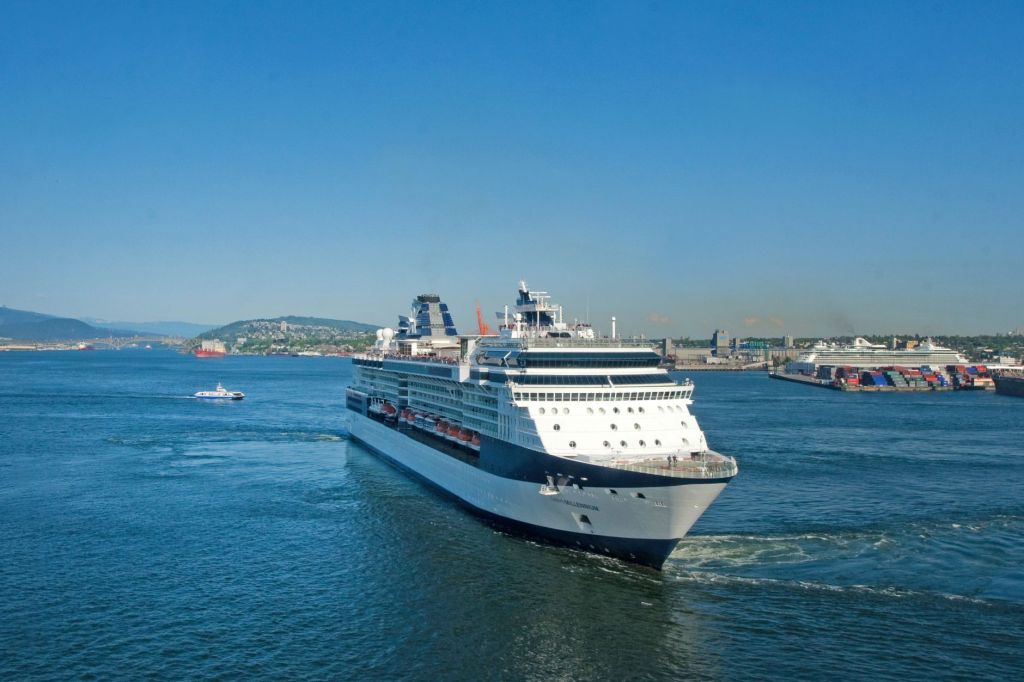
    Fuel is one of the biggest costs for a cruise company, and fuel prices have risen sharply this year. Yet Carnival, Royal Caribbean and Norwegian Cruise Line Holdings all reported strong third-quarter earnings. The interesting part is not just that they did well. It is that they got there in completely different ways.

    WHAT HAPPENED

    All three companies beat expectations in their latest quarters despite higher fuel prices. Carnival reported record net income of $1.9 billion. Royal Caribbean beat earnings-per-share expectations, though it narrowly missed on revenue. Norwegian beat on both revenue and earnings, reporting revenue of $2.9 billion and adjusted earnings per share of $1.12.

    Oil prices have risen sharply since mid-year. Brent crude, a global benchmark, settled at $116.72 per barrel on a recent trading day, a six-month high, driven by tensions in the Middle East. All three cruise operators expect fuel costs to keep rising in the fourth quarter.

    WHY IT HAPPENED

    The companies use two different strategies. Royal Caribbean and Norwegian use hedging. In simple terms, hedging means locking in a fuel price in advance using financial contracts, so that if market prices rise, the company is partly protected. Royal Caribbean said it is a little over 60% hedged for 2026. Norwegian has hedged about 48% of its fuel consumption for 2026.

    Carnival does the opposite. It does not hedge fuel. Instead, it tries to use less fuel. Chief executive Josh Weinstein has said that cutting fuel consumption is the best way to deal with expensive fuel, because fuel is an input cost, and using less of it directly lowers the bill. Carnival says it has cut its unit fuel consumption rate by 26% since 2019, and estimates that saved about $700 million in 2026.

    KEY FIGURES

    • Brent crude: $116.72 per barrel, a six-month high
    • Carnival third-quarter net income: $1.9 billion, a record
    • Carnival fuel spending: $615 million in the quarter, about 7.3% of revenue; $640 million projected for the fourth quarter
    • Carnival fuel consumption cut since 2019: 26%, saving an estimated $700 million in 2026
    • Royal Caribbean fuel spending: about $347 million, about 6.2% of revenue; $379 million projected for the fourth quarter
    • Royal Caribbean hedging: a little over 60% of 2026 fuel
    • Norwegian revenue: $2.9 billion; adjusted earnings per share: $1.12
    • Norwegian fuel spending: about $196 million, about 6.6% of revenue
    • Norwegian hedging: about 48% of 2026 fuel consumption

    WHY IT MATTERS

    Fuel is a good example of how there is rarely one right answer in business. Hedging protects a company when prices rise, but it costs money and can backfire if prices fall, because the company is locked into a higher price. Cutting consumption helps no matter what prices do, but it takes years of investment in more efficient ships and smarter routes.

    For passengers, the difference matters too. A company that is fully exposed to fuel prices is more likely to feel pressure to raise ticket prices or add extra charges when oil spikes. A company that has locked in prices has more breathing room, at least for a while.

    WHAT HAPPENS NEXT

    All three companies expect fuel costs to rise further in the fourth quarter. Royal Caribbean projects fuel spending of $379 million, Carnival projects $640 million, and Norwegian expects its fuel consumption to rise as well.

    The real test will come if oil stays high for a long time. Hedging only covers part of the fuel bill, and hedges eventually run out. Carnival’s efficiency gains, on the other hand, do not expire. The question for 2027 is whether Carnival’s long-term approach or its rivals’ hedging gives them a steadier result when the next fuel shock arrives.

    FINAL THOUGHTS

    Three companies, one problem, two very different answers, and all three worked this quarter. That is the lesson here. In business, a strategy is not good or bad in theory. It is good if it fits the company’s situation and holds up when conditions get tough. For now, both approaches are holding. The next oil spike will show which one holds up better.

    Related post: https://thefinanceclass.wordpress.com/2026/10/30/norwegian-cruise-shares-jump-earnings-beat/

    Disclaimer: This article is for educational and informational purposes only and does not constitute financial advice.

    Sources: CNBC, https://www.cnbc.com/2026/10/29/royal-caribbean-carnival-norwegian-fuel-costs.html ; Binance Square summary of CNBC reporting, https://www.binance.com/en/square/post/10-29-2026-carnival-royal-caribbean-and-norwegian-cruise-line-holdings-differ-on-fuel-cost-strategies-382586356239218

  • Frontier Airfares Jump 71% as Fuel Costs Soar and a Rival Disappears

    Frontier Airfares Jump 71% as Fuel Costs Soar and a Rival Disappears

    INTRODUCTION

    Flying with America’s largest budget airline is not as cheap as it used to be. Frontier Airlines said its average fare revenue per passenger jumped 71% in the third quarter, to $67.82, up from $39.74 a year earlier. The airline raised prices to deal with soaring fuel costs, and passengers kept booking anyway.

    WHAT HAPPENED

    Frontier reported record third-quarter total revenue of $1.355 billion, up 53% from a year earlier. It carried more than 9.8 million passengers, up 18%, or about 1.5 million more people than a year earlier. Capacity, which measures how many seats the airline flew, rose 18%.

    But higher prices did not turn into a profit. Frontier posted a net loss of $104 million in the quarter, wider than the $77 million loss a year earlier. The main reason was fuel. Its fuel bill soared 82% to $425 million. The airline paid an average of $3.96 per gallon for fuel in the quarter, 56% more than a year earlier.

    Including fees for bags and other extras, total revenue per passenger rose 30% to $138.22. That is an important detail: the 71% figure covers the ticket fare alone, not the full cost of flying.

    WHY IT HAPPENED

    Three things pushed fares higher, and Frontier’s chief executive Jimmy Dempsey said each played a roughly equal part. First, fuel got much more expensive, so the airline passed some of that cost to passengers. Second, Frontier got better at pricing, charging more on routes where demand was strong. Third, competition disappeared: Spirit Airlines stopped flying in May 2026, and Frontier added routes that Spirit used to fly, removing a direct low-fare rival from many markets.

    Fuel is the biggest pressure going forward. Frontier expects its average fuel cost to rise to about $4.75 per gallon in the fourth quarter. Industry airfares in September were already up about 22% from a year earlier, so Frontier’s jump is part of a wider trend, just a steeper version of it.

    KEY FIGURES

    • Average fare revenue per passenger: $67.82, up 71% from $39.74
    • Total revenue per passenger, including fees: $138.22, up 30%
    • Total revenue: $1.355 billion, up 53%, a third-quarter record
    • Passengers carried: more than 9.8 million, up 18%
    • Fuel bill: $425 million, up 82%
    • Average fuel cost: $3.96 per gallon in the quarter, vs about $4.75 expected in the fourth quarter
    • Net loss: $104 million, vs $77 million a year earlier

    WHY IT MATTERS

    Frontier is a test case for budget travel. The whole idea of a budget airline is low fares. When the cheapest airline raises its average fare by 71%, it shows how much pressure fuel prices are putting on the industry. It also shows that travellers are still willing to pay more, at least for now, since passenger numbers rose.

    It matters for holiday travel too. Frontier expects unit revenue, a measure of how much it earns per seat flown, to stay more than 20% higher in the holiday quarter. That points to fares staying well above last year’s levels through the holidays.

    WHAT HAPPENS NEXT

    Frontier forecast fourth-quarter results ranging from an adjusted loss of 15 cents per share to adjusted earnings of up to 5 cents per share. It also plans to keep capacity growth slower, at 5% to 6%, in the fourth quarter.

    The key question is fuel. If jet fuel prices stay high, fares will likely stay high as well. If fuel prices fall, Frontier could bring fares down, but with one less rival in the market, there is less pressure on it to do so quickly. Travellers booking holiday flights should compare the full price, including bag fees, rather than just the headline fare.

    FINAL THOUGHTS

    Frontier’s quarter tells a simple story: higher costs, higher fares, and still more passengers. The airline is making more money per passenger, but fuel is eating most of the gain. For travellers, the lesson is clear. Budget flying is still possible, but the gap between budget and regular airlines is getting smaller, and the cheapest ticket on the screen is rarely the full price you will pay.

    Related post: https://thefinanceclass.wordpress.com/2026/10/31/trump-energy-promise-gas-diesel-jet-fuel-prices/

    Disclaimer: This article is for educational and informational purposes only and does not constitute financial advice.

    Sources: CNBC, https://www.cnbc.com/2026/10/28/frontier-airlines-airfare-plane-tickets.html ; Fast Company, https://www.fastcompany.com/91631443/a-budget-airline-just-revealed-a-startling-change-in-the-cost-of-flying

  • Stellantis Shares Jump About 13% as Cost Cuts Start to Pay Off

    Stellantis Shares Jump About 13% as Cost Cuts Start to Pay Off

    INTRODUCTION

    Stellantis, the company behind Jeep, Ram, Chrysler, Fiat and Peugeot, gave investors a rare piece of good news this week. Its shares jumped about 13% after its third-quarter results showed that its cost-cutting plan is starting to work. The company is still losing money overall, and it is still burning cash, but the direction of travel improved enough to lift the stock sharply.

    WHAT HAPPENED

    Stellantis reported third-quarter net revenue of 37.6 billion euros, up 1% from a year earlier and above what analysts had expected, at around 36.4 billion euros. Adjusted operating income, which is profit before some one-off items, jumped 184% to 256 million euros, up from 90 million euros a year earlier. That left an adjusted operating margin of just 0.7%, which is still very thin. The net loss narrowed sharply to 453 million euros.

    The company also kept its full-year guidance unchanged. It still expects net revenue to grow by a mid-single-digit percentage in 2026, with a low-single-digit adjusted operating margin for the year. In a week when other carmakers cut their outlooks, simply holding the forecast counted as good news.

    WHY IT HAPPENED

    The main reason for the jump is cost savings. Chief executive Antonio Filosa said the turnaround plan, called FaSTLAne 2030, is running ahead of schedule. Cost savings from the plan were about 300 million euros in the third quarter, and the company expects them to roughly double to as much as 600 million euros in the fourth quarter.

    North America also helped. The region swung back to a small adjusted operating profit of 64 million euros, helped by new models such as the Jeep Cherokee hybrid and the Ram 1500 Hemi. Ram 1500 sales in the United States jumped 73% from a year earlier. Stellantis also lowered its estimate for full-year tariff costs to about 1 billion euros, down from an earlier estimate of up to 1.2 billion euros.

    Europe was the weak spot. The region posted an adjusted operating loss of 311 million euros, as lower prices and a shift toward less profitable electric cars weighed on results.

    KEY FIGURES

    • Third-quarter net revenue: 37.6 billion euros, up 1% year over year
    • Adjusted operating income: 256 million euros, up from 90 million euros
    • Adjusted operating margin: 0.7%
    • Net loss: 453 million euros, sharply narrower than a year earlier
    • Expected fourth-quarter cost savings: up to 600 million euros, from about 300 million euros
    • Industrial free cash flow: negative 4 billion euros in the quarter
    • Full-year tariff cost estimate: about 1 billion euros, down from up to 1.2 billion euros

    WHY IT MATTERS

    Stellantis stock is still down roughly 60% this year, even after this rally. That tells you how far it had fallen. When a stock has dropped that much, even a small improvement in profit can cause a big jump, because many investors had expected worse.

    The result also matters for the wider car industry. Carmakers are all dealing with the same problems: tariffs, higher costs, and slow demand for electric cars. Stellantis showed that cutting costs and fixing quality can move the numbers, even if sales barely grow.

    WHAT HAPPENS NEXT

    The next test is cash. Stellantis burned 4 billion euros of industrial free cash flow in the quarter. That was slightly better than the 4.3 billion euro outflow a year earlier, but it still missed what analysts expected. The company says it will reach positive free cash flow in 2027. Investors will watch the fourth quarter closely to see whether the promised doubling of cost savings actually shows up in cash, not just in profit figures.

    Watch for two more things: whether North America keeps improving, and whether Europe stops dragging results down. If both move in the right direction, the turnaround story gets much stronger. If not, this rally could fade quickly.

    FINAL THOUGHTS

    This was a relief rally, not a victory lap. Stellantis is making progress on costs, and that progress is real. But a 0.7% operating margin and negative cash flow mean the company still has a long way to go. The stock jumped because expectations were very low. The hard work of turning those savings into steady cash is still ahead.

    Related post: https://thefinanceclass.wordpress.com/2026/10/31/automakers-3d-printing-ford-rivian-gm-faster-cheaper/

    Disclaimer: This article is for educational and informational purposes only and does not constitute financial advice.

    Sources: CNBC, https://www.cnbc.com/2026/10/28/stellantis-45-billion-cash-drain-turnaround.html ; TipRanks, https://www.tipranks.com/news/stellantis-shares-jump-6-as-carmaker-keeps-full-year-guidance-and-third-quarter-profit-hits-e256-million

  • Gasoline Is $4.18 a Gallon, Not Under $2: What Happened to Trump’s Energy Promise

    Gasoline Is $4.18 a Gallon, Not Under $2: What Happened to Trump’s Energy Promise

    Introduction

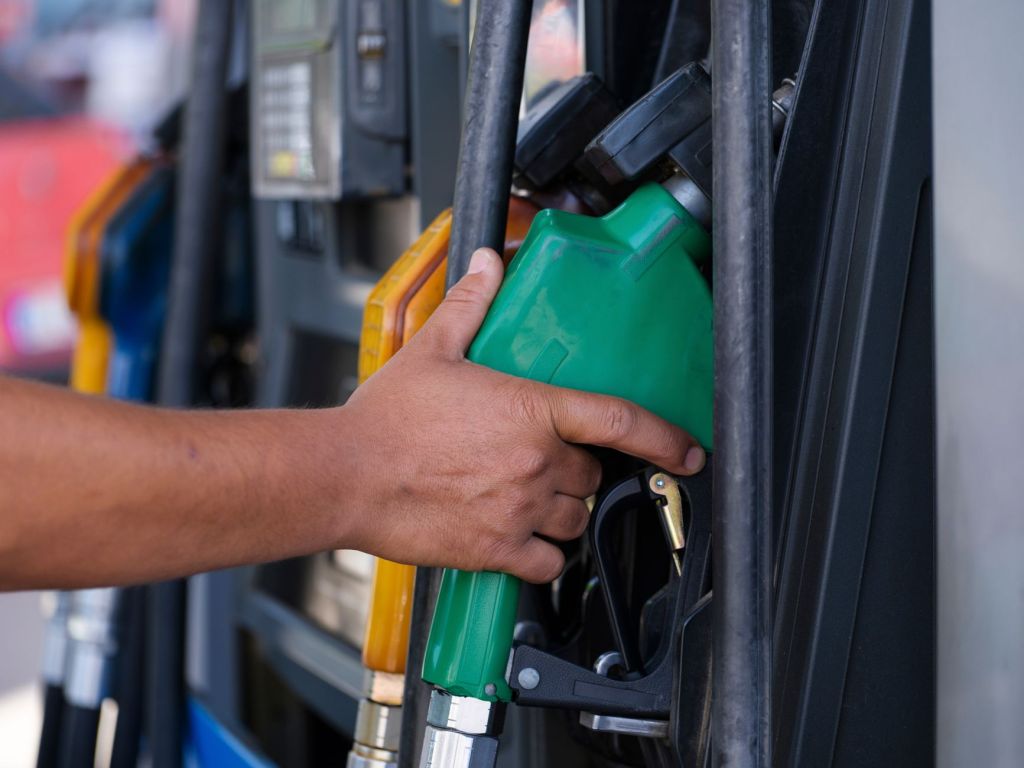
    When Donald Trump campaigned for president, he made a clear promise on energy: cut energy prices in half, and get gasoline below $2 a gallon. On October 31, 2026, the numbers tell a very different story. Regular gasoline averaged $4.18 a gallon across the United States, and diesel averaged $6.31. For drivers, truckers, and farmers, fuel is not cheaper. It is more expensive than it was a year ago.

    This matters right now because voters go to the polls for the midterm elections on November 3. Fuel prices are one of the costs people notice every week, and they feed into the price of food, flights, and almost everything that moves by truck.

    What Happened

    CNBC reported on October 31 that gasoline, diesel, and jet fuel have all risen instead of falling. The latest price data backs that up.

    Regular gasoline averaged $4.1837 a gallon on October 31. That is down from $4.2957 a week earlier and $4.4343 a month earlier, so prices have eased a little recently. But they are still well above $3.0403 a gallon on October 31, 2025.

    Diesel tells a similar story. It averaged $6.3101 a gallon on October 31, down slightly from $6.3374 a week earlier and $6.4139 a month earlier, but far above $3.6876 a year earlier.

    Jet fuel has risen even more sharply on one widely watched benchmark. The U.S. Gulf Coast spot price for kerosene-type jet fuel was $4.444 a gallon on October 27, compared with $2.250 on the same date in 2025. That is an increase of 97.5 percent. This is a regional spot benchmark, not the exact price any single airline pays, but it shows how much pressure airlines are facing.

    The original promise was ambitious. In a campaign speech on September 5, 2024, Trump said his plan would cut energy prices in half or more within 12 months of taking office, and he also promised gasoline below $2 a gallon.

    Key Figures

    • Regular gasoline, Oct. 31, 2026: $4.1837 a gallon (vs. $3.0403 a year earlier)
    • Diesel, Oct. 31, 2026: $6.3101 a gallon (vs. $3.6876 a year earlier)
    • Gasoline a week earlier: $4.2957; a month earlier: $4.4343
    • Diesel a week earlier: $6.3374; a month earlier: $6.4139
    • Gulf Coast jet fuel spot price, Oct. 27: $4.444 a gallon (vs. $2.250 a year earlier, up 97.5%)
    • Trump’s campaign promise: gasoline below $2 a gallon; energy prices cut in half

    Why It Happened

    There is no single reason fuel prices rose, and presidents do not set pump prices directly. Prices are set by a global market, and several forces pushed them up at the same time.

    First, war disrupted supply. The war involving Iran, which began in February 2026, raised fears about shipping through the Strait of Hormuz, a narrow waterway that carries a large share of the world’s oil. Attacks on energy infrastructure linked to the war in Ukraine also took fuel-making capacity offline. When crude oil and refined fuel become harder to move and make, prices usually rise.

    Second, refining capacity is tight. Refineries turn crude oil into gasoline, diesel, and jet fuel. When some refineries are shut or running below normal, there is less finished fuel to go around, even if crude oil is available. That shortage has helped push refining profits up sharply this year, a subject covered in recent earnings reports from major oil companies.

    Third, the timing worked against the promise. Cutting energy prices in half within a year would require a huge fall in global oil and fuel prices. Instead, the shocks above pushed prices in the opposite direction. Recent data shows gasoline and diesel have eased from their peaks over the past month, but that small pullback has not been enough to bring prices anywhere near $2.

    It is also worth being clear about what a president can and cannot do. A president can open up drilling, change regulations, release emergency oil reserves, or push allies to pump more. Those steps can help at the margins, but they do not control wars, global demand, or how much fuel refineries can produce.

    Related: Chevron Profit Nearly Triples to $9.9 Billion as Refining Boom Lifts Earnings

    Why It Matters

    Fuel prices hit almost everyone, but they do not hit everyone equally.

    For a driver, $4.18 gasoline means a normal fill-up costs much more than it did a year ago. For a trucking company, $6.31 diesel raises the cost of every delivery. Those costs often get passed on, which is one reason food prices and other goods can rise when fuel rises.

    For farmers, diesel powers tractors and trucks, and higher fuel costs squeeze thin margins. For airlines, jet fuel is one of the biggest expenses, so a near-doubling in a benchmark jet fuel price puts upward pressure on airfares.

    Politically, the gap between the promise and the price is hard to ignore. Energy was a central part of Trump’s pitch to voters: cheaper fuel would help bring down the cost of living. With midterms days away, voters are judging that promise against the price they see at the pump, not against the original speech.

    What Happens Next

    Three things are worth watching.

    One, whether the recent easing continues. Gasoline and diesel are both lower than they were a month ago. If supply improves and tensions ease, that trend could continue. If not, prices could rise again quickly.

    Two, whether refinery capacity comes back. More finished fuel on the market would help more than more crude oil alone, because the current squeeze is partly about turning oil into usable fuel.

    Three, what happens after the midterms. Energy policy debates often sharpen during campaigns and then shift once votes are counted. Any new steps on drilling, reserves, or trade could affect prices, but they will still have to work through the same global market.

    Final Thoughts

    This is a simple test with a clear result so far. The promise was gasoline below $2 and energy prices cut in half. The reality on October 31 is $4.18 gasoline, $6.31 diesel, and jet fuel nearly double its level from a year ago on a key benchmark.

    That does not mean prices can never fall. They already have eased a little from a month ago. But for now, the promise has not been met, and the reason is not a mystery: wars and tight refining capacity pushed a global market in the wrong direction. For households, the question is no longer about a campaign line. It is about how long they have to pay today’s prices.

    Disclaimer: This article is for educational and informational purposes only and does not constitute financial advice.

    Sources: CNBC, “Trump promised to slash energy costs — but gasoline, diesel and jet fuel all soared instead” (https://www.cnbc.com/2026/10/31/trump-gas-diesel-price-midterm-election.html); price data as reported by TokenPost, “U.S. Gasoline Averaged $4.18, More Than Double Trump’s Below-$2 Target” (https://www.tokenpost.com/news/investing/45502).

  • Cheaper Cars Are Selling Much Faster — But They Are Getting Harder to Find

    Cheaper Cars Are Selling Much Faster — But They Are Getting Harder to Find

    Introduction

    If you are shopping for a cheaper car in America right now, you are not alone — and you may be too late. New data shows affordable cars are selling much faster than they were at the start of the year. The catch is that there are not many of them to buy.

    What Happened

    Data from Edmunds, released October 30, 2026, shows that cars priced between $20,000 and $29,999 sold 20% faster in the third quarter than in the first quarter of 2026. Cars priced $30,000 to $39,999 sold about 18% faster, and cars priced $40,000 to $49,999 sold nearly 12% faster. Vehicles priced below $50,000 generally spent fewer than 60 days on dealer lots. Every price segment above $50,000 took more than 60 days to sell.

    Edmunds’ director of insights, Ivan Drury, said dealers with affordable cars in stock are “definitely noticing” the stronger demand.

    But here is the strange part: sales in some cheaper segments actually fell. Compact car sales are down roughly 4% since the beginning of 2026, and compact SUV sales are down nearly 8%, according to Cox Automotive. Cars are selling faster, but fewer of them are being sold in those segments — because there are not enough of them on the lots.

    Why It Happened

    Affordability is the main driver. The average new vehicle listed for $49,726 in September, according to Cox Automotive. With prices that high and fuel costs rising, buyers are hunting for anything cheaper. Many buyers of these fast-selling cheaper cars are first-time buyers or people buying a second car for the family, according to Edmunds.

    Supply is the other half of the story. The popular Toyota RAV4 has been in short supply as Toyota shifts production to its Kentucky factory and moves the lineup to hybrid engines. Ford discontinued the Escape to make room for an upcoming midsize electric pickup. When popular affordable models disappear or run short, the ones that remain sell quickly.

    Related reading: Ford Beats Earnings Expectations, but Warns 2027 Profit Will Be Flat

    There is also a structural shift. No compact passenger sedan is sold by an American manufacturer anymore, according to CNBC. Most are Japanese or Korean, with some German models such as the Volkswagen Jetta and Golf hatchback. The Honda Civic, Toyota Corolla and Jetta all start below $25,000, but the cheapest American options start higher — the Ford Mustang starts at $33,490 and the Tesla Model 3 at $34,990.

    Key Figures

    • $20,000–$29,999 cars: sold 20% faster in Q3 than Q1 2026
    • $30,000–$39,999 cars: sold about 18% faster
    • $40,000–$49,999 cars: sold nearly 12% faster
    • Under $50,000: fewer than 60 days on dealer lots; over $50,000: more than 60 days
    • Average new-vehicle listing price in September: $49,726 (Cox Automotive)
    • Compact car sales: down about 4% in 2026; compact SUVs: down nearly 8%
    • About 1 in 4 financed buyers took an 84-month loan in Q3, a record; nearly 3 in 10 Q3 trade-ins had negative equity

    Why It Matters

    This trend shows the pressure on ordinary buyers. When a car costs nearly $50,000 on average, people stretch to afford one — and the numbers prove it. Roughly one in four buyers who financed a purchase in the third quarter took out an 84-month loan, a record. That is seven years of payments. Nearly three in ten trade-ins in the same quarter carried negative equity, meaning buyers owed more on their old car than it was worth.

    Long loans and negative equity are warning signs. They mean buyers are paying more, for longer, to own cars that lose value. Incentives from dealers averaged about 6.6% of the average transaction price as of October, which helps a little, but it does not fix the basic problem: affordable cars are scarce.

    What Happens Next

    Analysts say the fourth-quarter data will matter a lot. Cox Automotive’s Mark Strand cautioned that the market should be graded “on a curve” until that data arrives, because supply problems may be distorting the picture. If automakers bring back more affordable models — or if supply of models like the RAV4 recovers — the fast-selling trend could ease. If not, buyers will keep competing for a small pool of cheaper cars, and loan terms could stretch even further.

    Final Thoughts

    Faster sales sound like good news, but in this case they are a sign of scarcity, not strength. When cheap cars sell in days and expensive ones sit for months, the market is telling us something simple: most people want to spend less, and they cannot find enough cars that let them. Until supply improves, affordable cars will stay the hardest ones to buy.

    Disclaimer: This article is for educational and informational purposes only and does not constitute financial advice.

    Sources: CNBC, “Cheaper cars are selling considerably faster than at the beginning of the year” (https://www.cnbc.com/2026/10/30/cheap-cars-selling-fast.html); Edmunds Q3 2026 data and Cox Automotive figures as reported.

  • Anthropic’s Road to the Stock Market Just Got Rockier as AI Spending Worries Investors

    Anthropic’s Road to the Stock Market Just Got Rockier as AI Spending Worries Investors

    Introduction

    Anthropic, the AI company behind the Claude chatbot, picked a difficult week to head toward the stock market. Just days after it released its IPO prospectus, Microsoft, Google and Amazon reported results that added to investors’ worries about how much money the AI boom is eating up.

    What Happened

    Anthropic released its IPO prospectus on Monday, October 26, 2026. The document showed a net loss of $80 billion for the first half of the year, hundreds of billions of dollars in future computing commitments, and more than 90 pages of risk factors. The company plans to list on the Nasdaq under the ticker ANT, but it has not yet set a price range, share count or fundraising size.

    Then the big tech results landed. Microsoft lowered its capital spending forecast for the year to $170 billion, down from $175 billion. Alphabet, Google’s parent, kept guidance for spending of up to $205 billion. Amazon repeated a forecast of roughly $220 billion. All three figures came in below what analysts had expected, according to CNBC.

    Cash flow told an even sharper story. Amazon reported negative free cash flow for a second straight quarter, with a $42.4 billion outflow over the past 12 months. Google reported negative free cash flow of $9.1 billion, and its stock fell almost 13% on Thursday. Microsoft stayed cash-flow positive at $18.6 billion, but that was down sharply for a second straight quarter, and the company announced plans to raise $25 billion in bonds.

    The wider market felt it too. The Nasdaq Composite fell 2.9% on Friday, marking its first three-week losing streak since March. Nvidia traded lower, and Intel’s weak forecast sent its stock to its steepest drop since the 1970s.

    Related reading: Nasdaq Ends October With Its Worst Month Since March 2025 as Tech Sell-Off Deepens

    Why It Happened

    Building AI systems is extremely expensive. Companies need huge data centers, powerful chips and enormous amounts of electricity. Anthropic’s prospectus makes that cost visible: hundreds of billions of dollars promised for computing power in the years ahead.

    Investors are now asking a simple question: when does all this spending turn into profit? Cloud revenue at Microsoft, Google and Amazon beat analysts’ expectations — Google’s cloud revenue more than doubled from a year earlier — but that was not enough to calm the market. When even strong cloud growth comes with negative cash flow, investors start to worry about how the bills get paid.

    The IPO market has also gone quiet. It has largely been frozen since SpaceX’s record offering in June. Other companies, including Oura, Firmus and SK Hynix’s Solidigm unit, have recently delayed or dropped IPO plans. As Futurum Group CEO Daniel Newman put it, “Anthropic is the IPO market at this point.”

    Key Figures

    • Anthropic: $80 billion net loss in the first half of 2026; $16.3 billion in first-half revenue (per its filing)
    • Anthropic: hundreds of billions of dollars in future computing commitments
    • Microsoft: capital spending forecast cut to $170 billion from $175 billion; free cash flow $18.6 billion; $25 billion bond plan
    • Alphabet: spending guidance up to $205 billion; negative free cash flow of $9.1 billion
    • Amazon: spending forecast roughly $220 billion; $42.4 billion free cash outflow over 12 months
    • Nasdaq Composite: down 2.9% on Friday, October 30

    Why It Matters

    Anthropic’s IPO is a test for the whole AI sector. If one of the most important AI companies struggles to convince public investors, it could make fundraising harder for others. It could also force AI companies to show clearer paths to profit instead of just growth.

    For ordinary investors, the lesson is about balance. AI is real technology with real revenue growth. But growth funded by massive spending and debt carries risk, and this week showed how quickly excitement can turn into doubt when cash flow goes negative.

    What Happens Next

    Anthropic still has to fill in the missing pieces of its offering — price, share count and size — and investors are still waiting for its third-quarter financials. Oracle, meanwhile, said it will limit additional fundraising in coming years to $20 billion and turn cash flow positive in the second half of its next fiscal year, a sign that even big AI spenders feel pressure to show discipline.

    Watch the next round of results and Anthropic’s pricing decision. If the IPO prices well, it could reopen the market for other tech listings. If it struggles, the freeze could last longer.

    Final Thoughts

    Anthropic is not in trouble because its technology failed. It is facing a market that has started asking harder questions about AI spending. That is a healthy question, even if it makes the road to the Nasdaq bumpier. The companies that answer it with real cash flow, not just big promises, will be the ones investors trust.

    Disclaimer: This article is for educational and informational purposes only and does not constitute financial advice.

    Sources: CNBC, “Anthropic’s path to the Nasdaq just got a lot bumpier” (https://www.cnbc.com/2026/10/31/anthropic-ipo-ai-spending.html); Anthropic S-1 filing coverage (revenue of $16.3 billion in H1 2026, Nasdaq ticker ANT).

  • How Ford, Rivian and GM Are Using 3D Printing to Build Cars Faster and Cheaper

    How Ford, Rivian and GM Are Using 3D Printing to Build Cars Faster and Cheaper

    Introduction

    Car factories are starting to print their own parts. Ford, Rivian and General Motors are now using 3D printing — also called additive manufacturing — for much more than prototypes. They are printing factory tools and selected production parts right on the factory floor, and the main reason is simple: speed.

    What Happened

    Rivian has spent more than $5 million on 3D-printing machines, and it spends about $1.7 million a year on printing materials. The company says the machines usually pay for themselves within a year. Parts that once took weeks to make can now be ready in days, and sometimes in hours. Rivian’s latest expansion includes machines for flexible silicone parts and a new machine bay at its plant in Normal, Illinois.

    Ford has gone even further with everyday access. The company has additive-manufacturing departments at many of its plants, including a vending machine for 3D-printed F-150 parts near Dearborn, Michigan. Workers can request parts and tools through an app. Ford expects to have 3D labs at more than 23 plants by the end of this year, with more than 200 machines in its current program. In one case, a 3D-printed part kept a production line running until a replacement from a supplier arrived.

    GM is using the technology on its most exclusive cars. Its hand-built Cadillac Celestiq uses 135 3D-printed components, and its Cadillac Blackwing sedans include printed parts such as a medallion on the manual shifter knob. GM has also expanded its use of industrial Stratasys printers, which can cost hundreds of thousands of dollars depending on the job, training and certification.

    Why It Happened

    Traditional car parts take time. A factory usually has to order a tool or part, wait for a supplier to make it, and then wait for shipping. If the part is only needed in small numbers, that wait is hard to justify.

    3D printing flips that process. A digital design goes straight to a printer on site. Engineers can test a part, change the design, and print it again the same day. For tools like jigs and brackets that help workers build cars, that speed matters more than the cost of the printer itself. As Jared Beck, Rivian’s head of additive manufacturing, put it, the company is “democratizing 3D printing for the entire company” — and while savings run “well in the millions,” speed is the main point.

    Key Figures

    • Rivian: more than $5 million spent on 3D-printing machines; about $1.7 million a year on materials
    • Rivian: machines typically pay for themselves within a year
    • Ford: 3D labs expected at more than 23 plants by end of 2026; more than 200 machines in the program
    • GM: 135 3D-printed components in the Cadillac Celestiq

    Why It Matters

    For car buyers, this is not about a single part. It is about how fast a car company can fix problems, test new ideas and keep lines moving. A factory that can print a broken tool overnight does not have to stop work while it waits for a supplier. Over time, that can mean fewer delays and lower costs — and for companies like Rivian, which is preparing its cheaper R2 SUV, lower costs are essential.

    Related: Rivian Beats Earnings Expectations as Its Cheaper R2 SUV Takes the Lead

    It also shows how manufacturing is changing. 3D printing used to be a lab tool for prototypes. Now it is a factory tool for real work. Companies are still not printing whole cars, and high-volume parts are still made the traditional way. But for low-volume parts and factory tools, printing is becoming normal.

    What Happens Next

    Expect more printers on more factory floors. Ford’s plan for 23-plus labs shows the direction, and Rivian’s new machine bay points the same way. The next test will be whether these savings show up in the companies’ results — faster production, fewer delays and lower costs per vehicle. If they do, other automakers will follow quickly.

    Final Thoughts

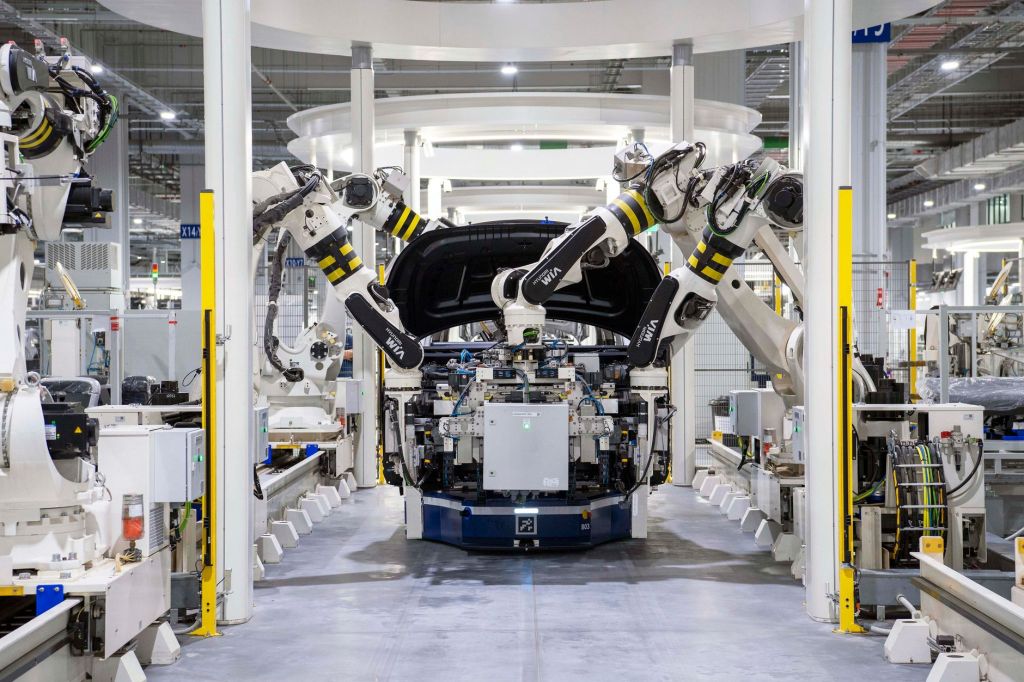
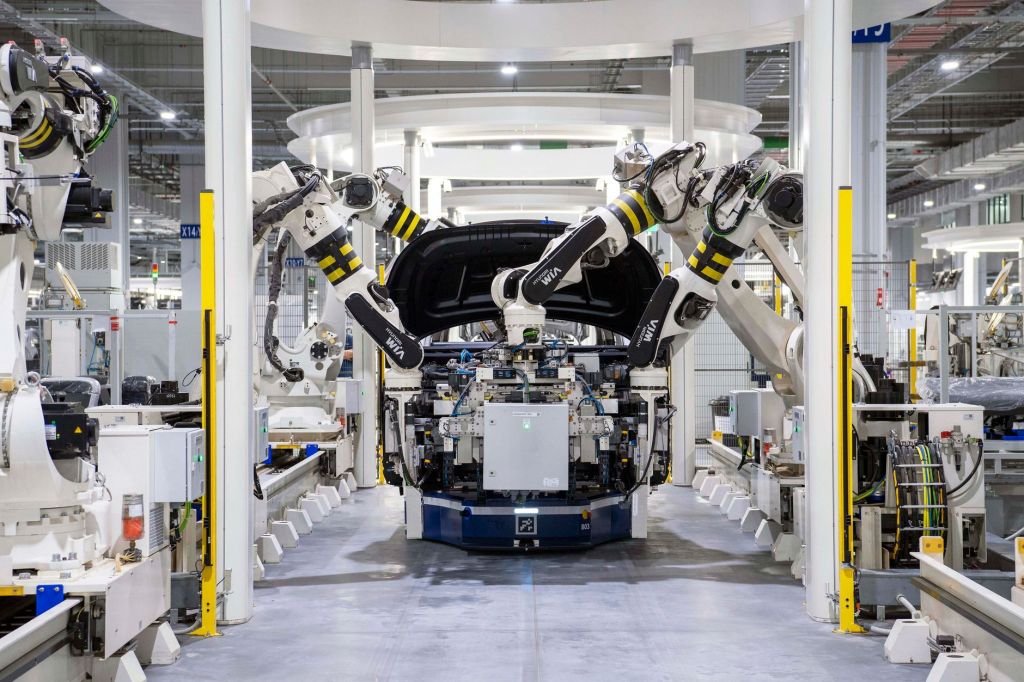
    3D printing will not replace traditional car factories. But it is already changing how those factories solve problems. When a part can be printed in hours instead of ordered in weeks, the whole factory moves faster. For an industry where every hour of downtime costs money, that is a big deal.

    Disclaimer: This article is for educational and informational purposes only and does not constitute financial advice.

    Sources: CNBC, “Automakers like Rivian and Ford are ‘democratizing 3D printing’ to reduce costs and increase speed” (https://www.cnbc.com/2026/10/31/automakers-3d-printing-ford-rivian-gm.html); Stratasys/Rivian factory-floor reporting on the F870 platform adoption.

  • ServiceNow Shares Plunge 27% to Worst Day Ever as AI Disruption Fears Hit Software

    ServiceNow Shares Plunge 27% to Worst Day Ever as AI Disruption Fears Hit Software

    Introduction

    ServiceNow shares fell 27% on Thursday, October 29, their worst single day ever. The enterprise software company reported results that were mostly solid, but investors focused on one disappointment, and the stock paid the price.

    What Happened

    ServiceNow reported third-quarter revenue of $4.11 billion, up more than 20% from a year earlier and slightly above the roughly $4.10 billion analysts expected. But adjusted earnings came in at $1.00 per share, below the $1.02 forecast.

    The bigger problem was the outlook. ServiceNow forecast growth of 18.5% in its current remaining performance obligations, a measure of contracted revenue for the coming months, below what Wall Street expected and slower than the previous quarter. The shares closed Thursday at $109.67, down from $150.13 the day before, and fell further on Friday to close the week at $105.12, a weekly drop of about 34%.

    ServiceNow was not alone. Fortinet, a cybersecurity company, fell 20% the same day after its own results. Other software stocks, including Salesforce, Snowflake and Workday, also fell during the week as the whole sector sold off.

    Why It Happened

    The market fear has a nickname: the “SaaSpocalypse.” The idea is that AI tools could replace the kind of business software that companies like ServiceNow sell. If AI can do the work directly, why pay for a software subscription?

    ServiceNow’s own numbers argued against that fear. The company raised its full-year 2026 subscription revenue outlook to $15.78–15.79 billion, and said net new AI contract value jumped 65%. It also raised its target for AI contracts to at least $1.7 billion for the year.

    But investors were not in a listening mood. ServiceNow’s finance chief pushed back on the reaction, arguing that the backlog metric is a nuanced accounting measure that does not capture all of the company’s momentum. Wall Street mostly stayed optimistic: Oppenheimer kept a Buy rating on the stock, arguing that ServiceNow’s AI momentum counters the idea that it is being disrupted, even if growth is not speeding up yet.

    Why It Matters

    ServiceNow’s fall shows how unforgiving this market has become for software stocks. A company can grow revenue more than 20%, raise its outlook, and still lose more than a quarter of its value in a day because one forecast number disappointed.

    It also shows how the AI story cuts both ways. Companies building AI tools are being rewarded, but companies that might be replaced by AI tools are being punished, even when their own AI business is growing fast. Investors are sorting the software sector into winners and losers, and they are doing it quickly.

    For context, ServiceNow’s shares have now lost 41.5% since October 28, 2025, while the S&P 500 gained 13.3% over the same period, according to Trefis analysis of closing prices.

    What Happens Next

    ServiceNow reports fourth-quarter results in January 2027. Between now and then, investors will watch whether its AI contracts turn into real revenue growth, and whether the backlog growth rate steadies or keeps slowing.

    The wider software sector faces the same test. If AI spending keeps rising but software earnings keep disappointing, the sell-off could continue. If companies show that AI is adding to their business rather than replacing it, the sector could recover.

    Final Thoughts

    ServiceNow’s story is a useful warning for investors. A single number in a report can matter more than the whole picture, especially when the market is already nervous. The company’s AI business is growing, its revenue outlook went up, and analysts still mostly like the stock. None of that stopped a 27% fall. In a market like this, expectations are everything, and meeting them is not always enough.

    Disclaimer: This article is for educational and informational purposes only and does not constitute financial advice.

    Sources: CNBC coverage “ServiceNow shares plunge 27% to worst day ever after earnings revive AI disruption fears”: https://www.cnbc.com/2026/10/29/servicenow-now-earnings-q3-2026.html; Trefis analysis (https://www.trefis.com/stock/now/articles/621573/what-is-behind-the-move-in-servicenow-stock/2026-10-30) and Motley Fool (https://www.fool.com/investing/2026/10/29/servicenow-stock-just-plunged-more-than-20-in-a-single-day-here-s-what-it-did-after-its-other-biggest-drops/).

  • Bitcoin Falls Below $77,000 After $6.3 Billion Binance Hack, the Largest Crypto Theft Ever

    Bitcoin Falls Below $77,000 After $6.3 Billion Binance Hack, the Largest Crypto Theft Ever

    Introduction

    Bitcoin fell below $77,000 for the first time in more than a month on Friday, October 30, after Binance, the world’s largest crypto exchange, disclosed a hack worth about $6.3 billion. It is the largest theft in crypto history.

    What Happened

    Bitcoin dropped as much as 3.1% on Friday, hitting a low of about $76,300, according to Bloomberg. It had spent most of the week trading near $80,000 before the hack news pushed it through that level.

    Binance’s own token, BNB, fell roughly 5% over 24 hours to around $700. Crypto liquidations topped $1.55 billion in a day, with more than 246,000 traders liquidated, according to CoinGlass data.

    Binance said it has set aside $6.34 billion of company funds to deal with the fallout. Around $3 billion in affected assets has been frozen with the help of blockchain partners. Deposits and withdrawals were temporarily suspended while the exchange carried out security checks, with a target of restarting in about 40 hours. Binance co-CEO Yi He said the exchange will cover all user losses.

    The early investigation points to a compromised laptop belonging to a Binance engineer, which attackers may have used to submit unauthorised withdrawals. Binance said it found no evidence that wallet private keys were leaked. Investigators have linked the attack to North Korea, according to CoinDesk’s live coverage.

    Why It Happened

    Two things hit crypto at once. The hack itself shook trust, even at the biggest exchange in the industry. And it landed on a day when stock markets were already falling, with the Nasdaq down almost 3%. When investors are nervous everywhere, risky assets like crypto usually fall first and fastest.

    The size of the theft is what makes this different from past exchange hacks. At about $6.3 billion, it is larger than any previous crypto theft, and it happened to the exchange that many people assumed was the safest place to keep crypto.

    Why It Matters

    Here are the key figures:

    • About $6.3 billion stolen, the largest crypto theft on record.
    • About $3 billion frozen so far through blockchain partners.
    • $6.34 billion set aside by Binance from company funds.
    • Bitcoin down 8.4% in October, on track for its second straight October decline.
    • BNB down about 5% in 24 hours to around $700.

    For ordinary crypto holders, the practical question is simple: is my money safe on an exchange? Binance says it will cover all user losses through its emergency fund and company resources, and it has promised updated proof of reserves after the cleanup. But the hack is a reminder that keeping large amounts of crypto on any single exchange carries real risk, no matter how big that exchange is.

    What Happens Next

    Watch three things. First, whether Binance restarts deposits and withdrawals on schedule and whether any more funds are recovered. Second, whether regulators respond, since a theft of this size will be hard for them to ignore. Third, whether bitcoin holds above its 200-day moving average near $73,000, which some analysts see as the next important support level if selling continues.

    Final Thoughts

    Crypto has survived big hacks before, and bitcoin has recovered from worse price falls. But each major theft chips away at trust, and trust is the one thing the crypto industry cannot buy. Binance’s promise to cover losses will help in the short term. The longer test is whether exchanges can prove their security is strong enough for the size they have reached.

    Disclaimer: This article is for educational and informational purposes only and does not constitute financial advice.

    Sources: CNBC coverage of the Binance hack: https://www.cnbc.com/2026/10/29/circle-tether-freeze-funds-impacted-by-potential-binance-security-issue.html; Bloomberg reporting via Economy24 (https://economy24.co.za/2026/10/bitcoin-drops-below-77000-as-binance-hack-shakes-crypto-market/) and CoinDesk live coverage (https://www.coindesk.com/markets/2026/10/30/live-news-binance-hack-rattles-crypto-as-intel-plunges-and-ai-spending-fears-hit-tech?post-id=1bc35b949f0e).

Is this your new site? Log in to activate admin features and dismiss this message
Log In